DIGITAL MANUFACTURING - PRODUCTION CHALLENGE
Author: Callum Baxter Date: 18/05/2023 Topic: Digital Design and Manufacturing
Introduction
The coursework brief required the digital simulation of a production line that could assemble 50,000 phone cases annually. However, this production target was then expanded for an extra-curricular task. This extra-curricular task required the annual production target to be maximised but take into account some financial limitations and assumptions. The specifications for this brief can be found below.
Assumptions
You have a budget of £1,000,000 to make improvements of additions to your production line.
Festo stations are priced according to Figure 1.
After all costs, each phone gives a profit of £20.
Workers cost the company £20 an hour during the day and £25 an hour during the night and weekends.
Workers do no come out of the £1,000,000 investment but any worker cost must be equalled by increased sales.
For simplicity, ignore energy costs.
Whilst you wouldn’t have infinite space, you may assume you have enough room in which to install new stations.
You have enough material/part supplies to satisfy production.
You can sell every phone you produce.
You cannot remove a station from the assembly production line. Each process must be completed as normal.
Attempt to answer the following questions
What is the maximum number of phones you can theoretically produce in one year?
What is the return on investment (ROI), the time taken to recover the initial cost of your expenditure?
Customers demand new products at increasing regularity, how many phones could you produce in one year if your manager demands ROI of only twelve months?
Figure 1. Festo station pricing (£)
Improving THE EXISTING PRODUCTION LINE
The digital twin of the Festo Cyber-Physical Lab produced in week seven’s blog was used as a foundation upon which to expand production capacity (figure 2, below). The Siemens Mindsphere interface was not used to complete this challenge due to the educational license expiring. As a result, the model reverted to using the processing times recorded during week seven’s blog (figure 3, below).
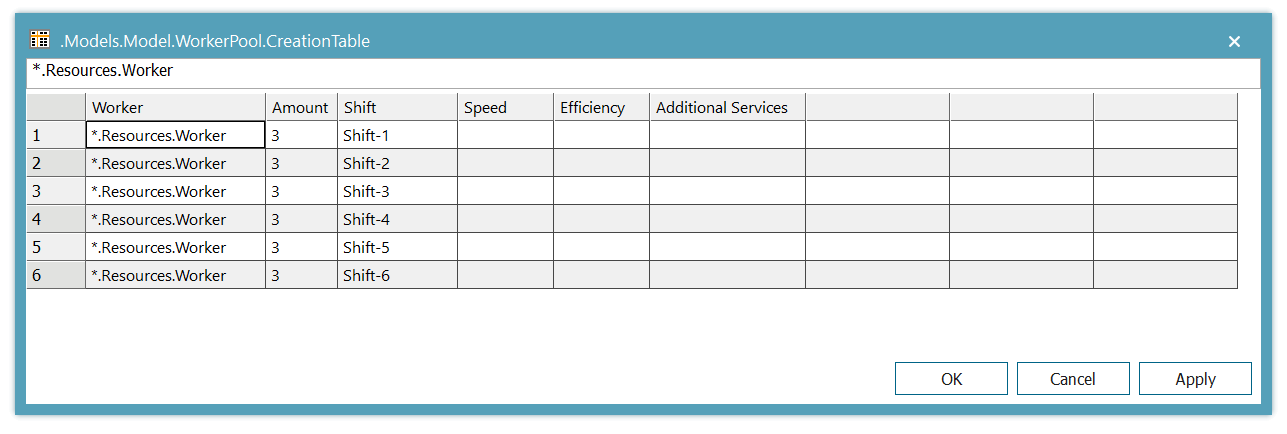
To increase the production of the Festo Lab in its current state, worker shift patterns needed to cover an entire 24 hour period for seven days a week. Only then could production begin to be maximised. Using the shift patterns in figure 4 (above) a working week is split into 6 shifts that cover days, nights and weekends. Costing for workers can then be calculated using these shift patterns and the prices detailed in the introduction of this blog. Workers are only required to work the pick-by-light station, therefore it can be said that for every additional pick-by-light station included within the assembly line the production company will incur the following additional cost.
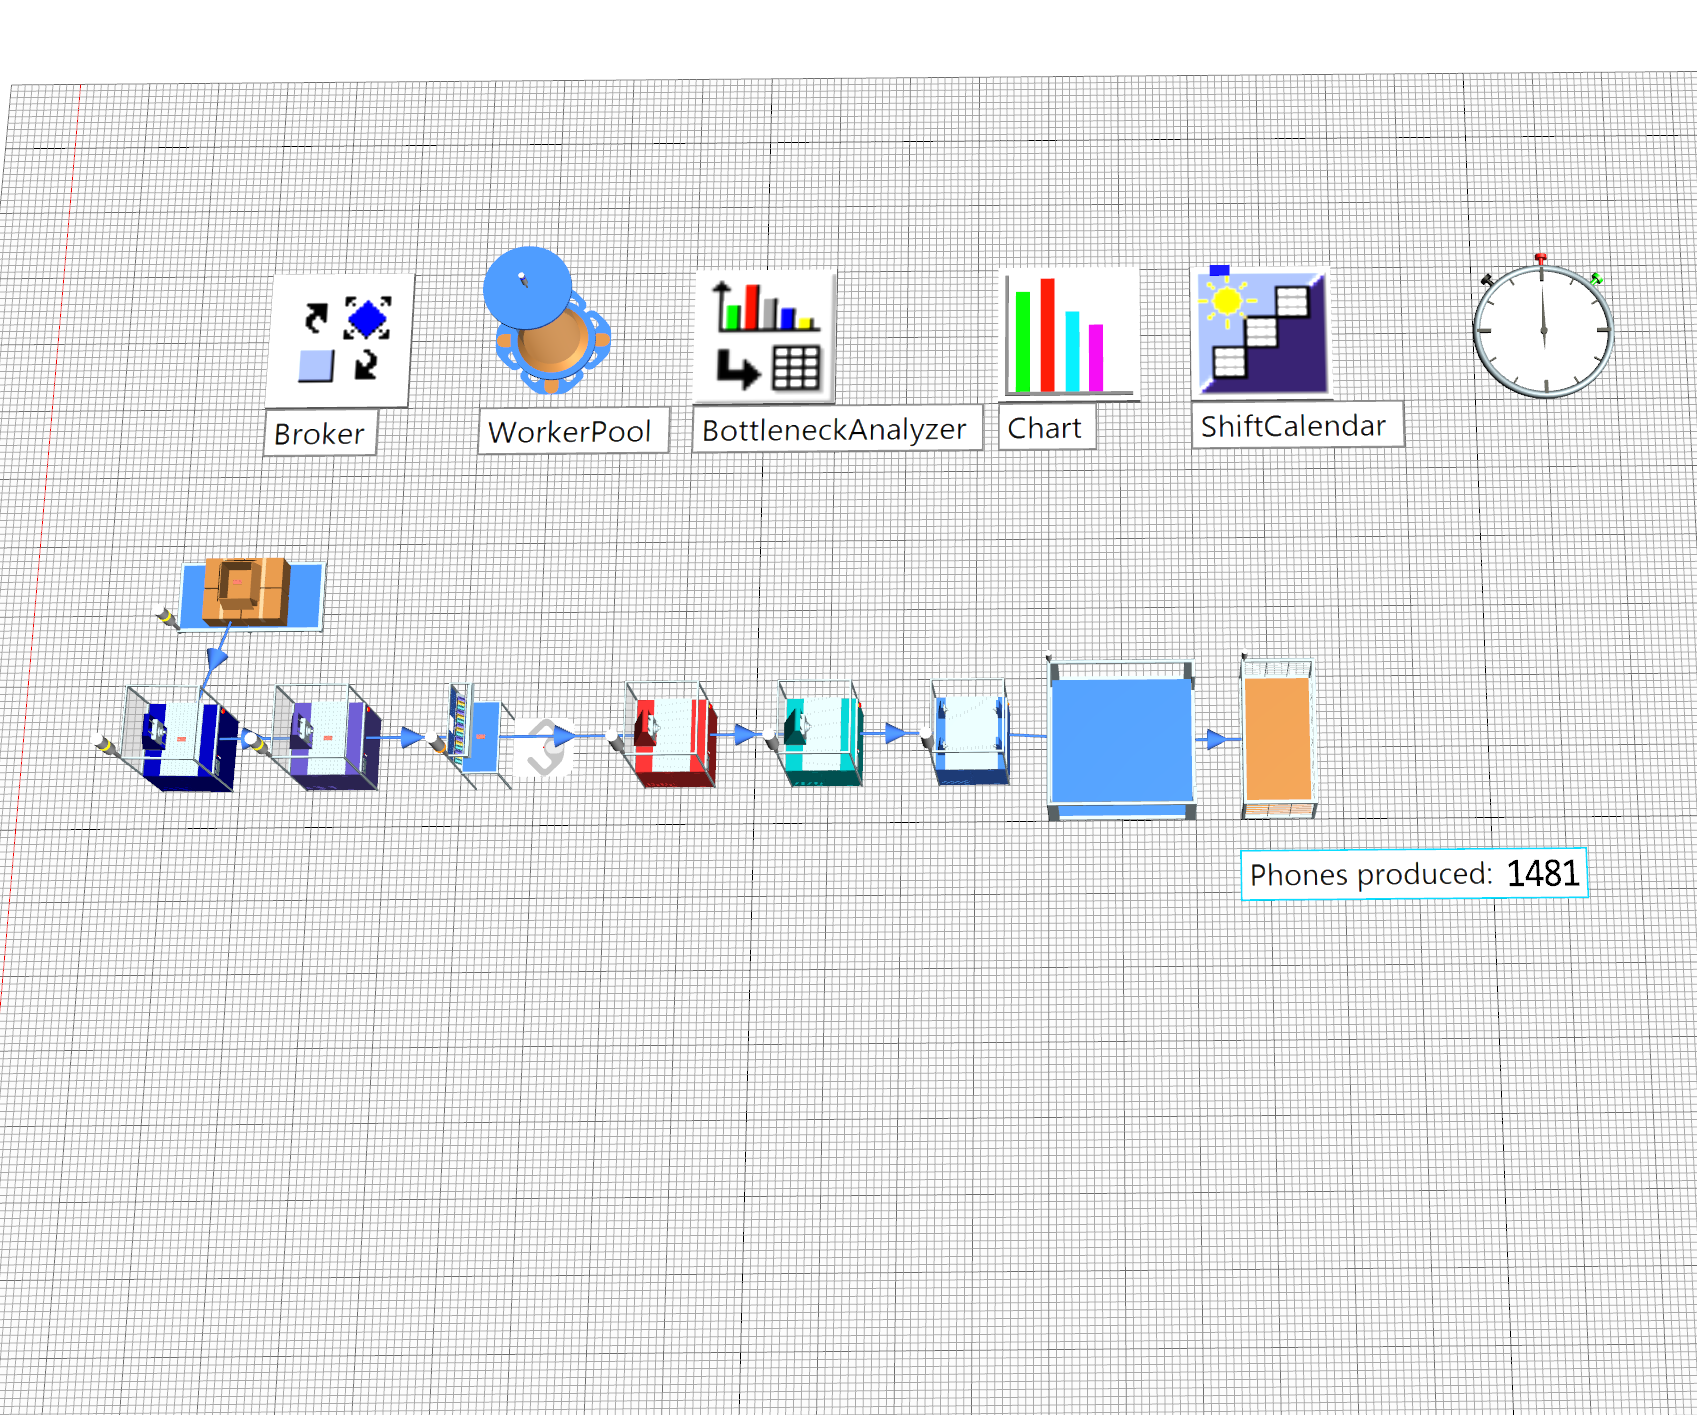
Now that stations and their associated costs have been fully determined, work can begin to minimise bottlenecks within the assembly line and maximise phone case production. For reference, figure 5 shows the production capability of the original Festo assembly line running for 24 hours.
Figure 5. Festo Lab running 24 hour shifts
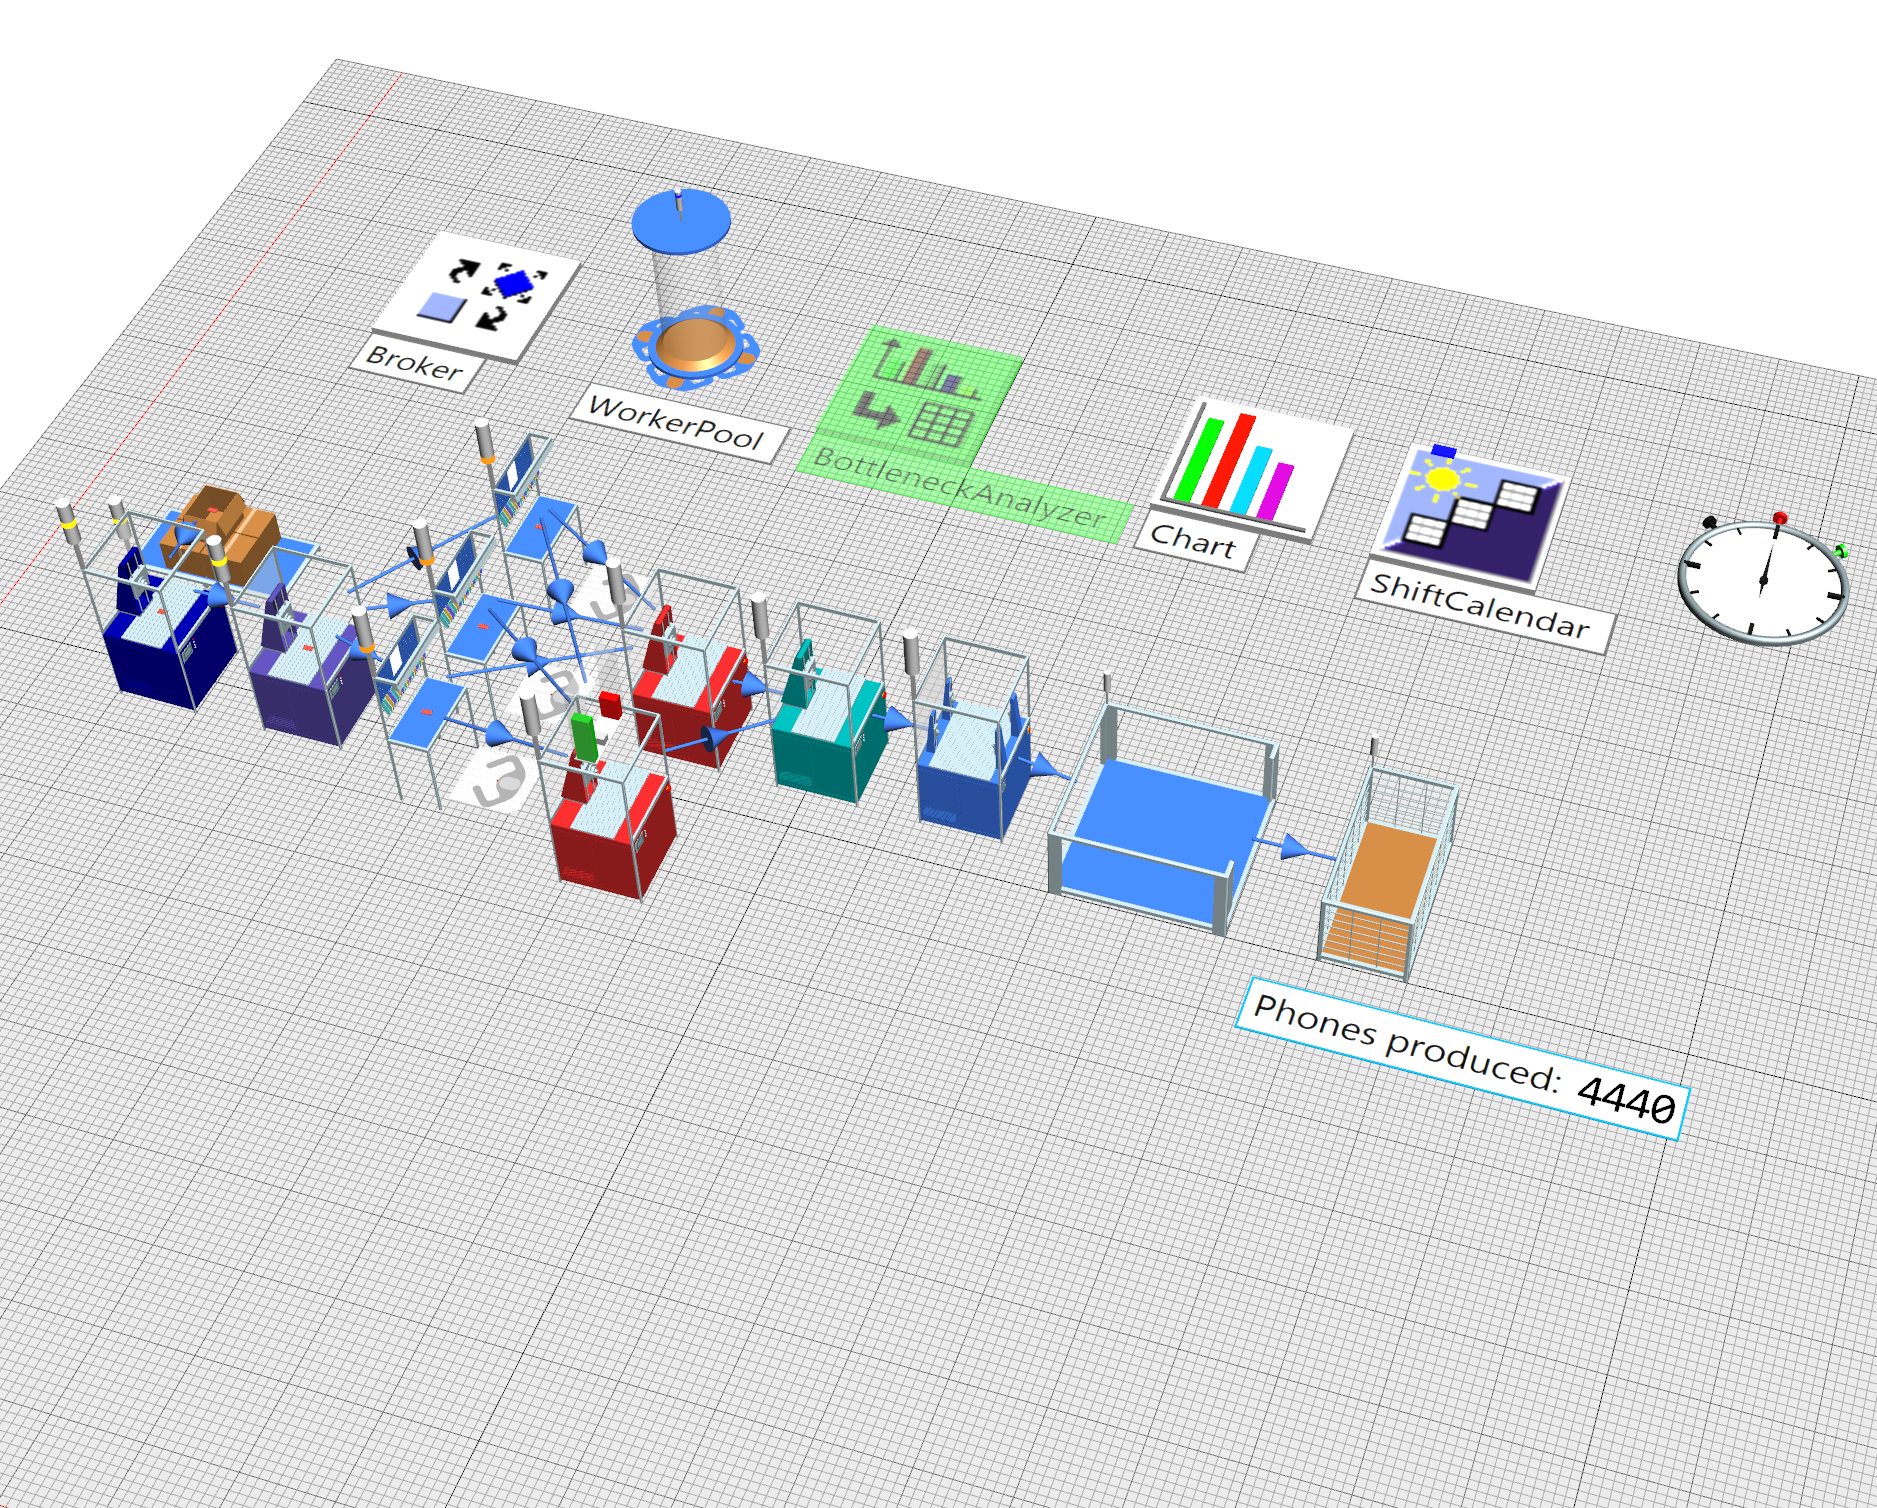
Utilising the bottleneck analyser built into Siemens Plant Sim, efficiencies were made to maximise production. Figures 6 and 9 (below) show the costing table used to calculate the total cost of the improved Festo assembly line and the digital twin simulation, respectively. As illustrated in figure 6, the total cost for the optimised Festo assembly line is below the limit of £1,000,000. Spending £981,850 will allow a production company to produce a total of 4,440 phone cases within any 24 hour period. Therefore, over a period of one year (365 days), a production company could expect to produce 1,622,060 phones cases and receive an income of £32,441,200. The initial investment of £981,850 would be repaid after only twelve days (4,440 x £20 = £88,800 and £88,000 x 12days = £1,065,600).
Figure 6. Cost table for optimised production line.
Figure 7. Worker resource table and shift assingments
Figure 8. Bottleneck analysis for optimised production line
Figure 9. Optimised production line
The button below will download a version of the digital twin that was used to complete this challenge. It is important to note that this file is only viewable within Siemens Plant Sim.


